
Get evidence-based answers about which design changes actually help your users succeed. My A/B Testing Reports translate complex test data into clear actions that improve your product.
Who Needs A/B Testing Reports?
- UX teams struggling to prove design impact
- Product managers prioritising interface changes
- Digital leaders making evidence-based decisions
- Marketing teams seeking proven conversion improvements
- UX designers validating design changes
- Product owners maximising feature adoption
- Digital teams reducing bounce rates
A/B testing reports present findings from controlled experiments comparing two or more versions of a webpage or app feature. These reports analyse user behaviour and conversion metrics to determine which version performs better against specific goals. They provide a scientific basis for design decisions, helping to eliminate guesswork and personal preferences from the optimisation process.
Key Components of A/B Testing Reports:
Test Overview
Description of the hypothesis, variables, and goals
Methodology
Processes & statistical performance information.
User Insights
Interaction patterns and visual data findings.
Recommendations
Proposals for follow-up tests or further optimisation

Why A/B Testing Matters
✓ User Success: A/B testing allows teams to make data-driven design decisions, improving usability and conversion rates (Nielsen Norman Group, 2023)
✓ Efficiency: Automated analysis of A/B test results saves time and reveals meaningful patterns in user behaviour, reducing reliance on manual observation (Optimizely, 2023)
✓ Stakeholder Confidence: Visualising statistically valid results from A/B tests builds trust in decisions and supports evidence-based product improvements (VWO, 2023)
Without proper analysis and reporting, card sorting exercises can fail to yield actionable insights, limiting their impact on information architecture and usability (Nielsen Norman Group, 2020).
Benefits of A/B Testing Reporting
The A/B Testing Process
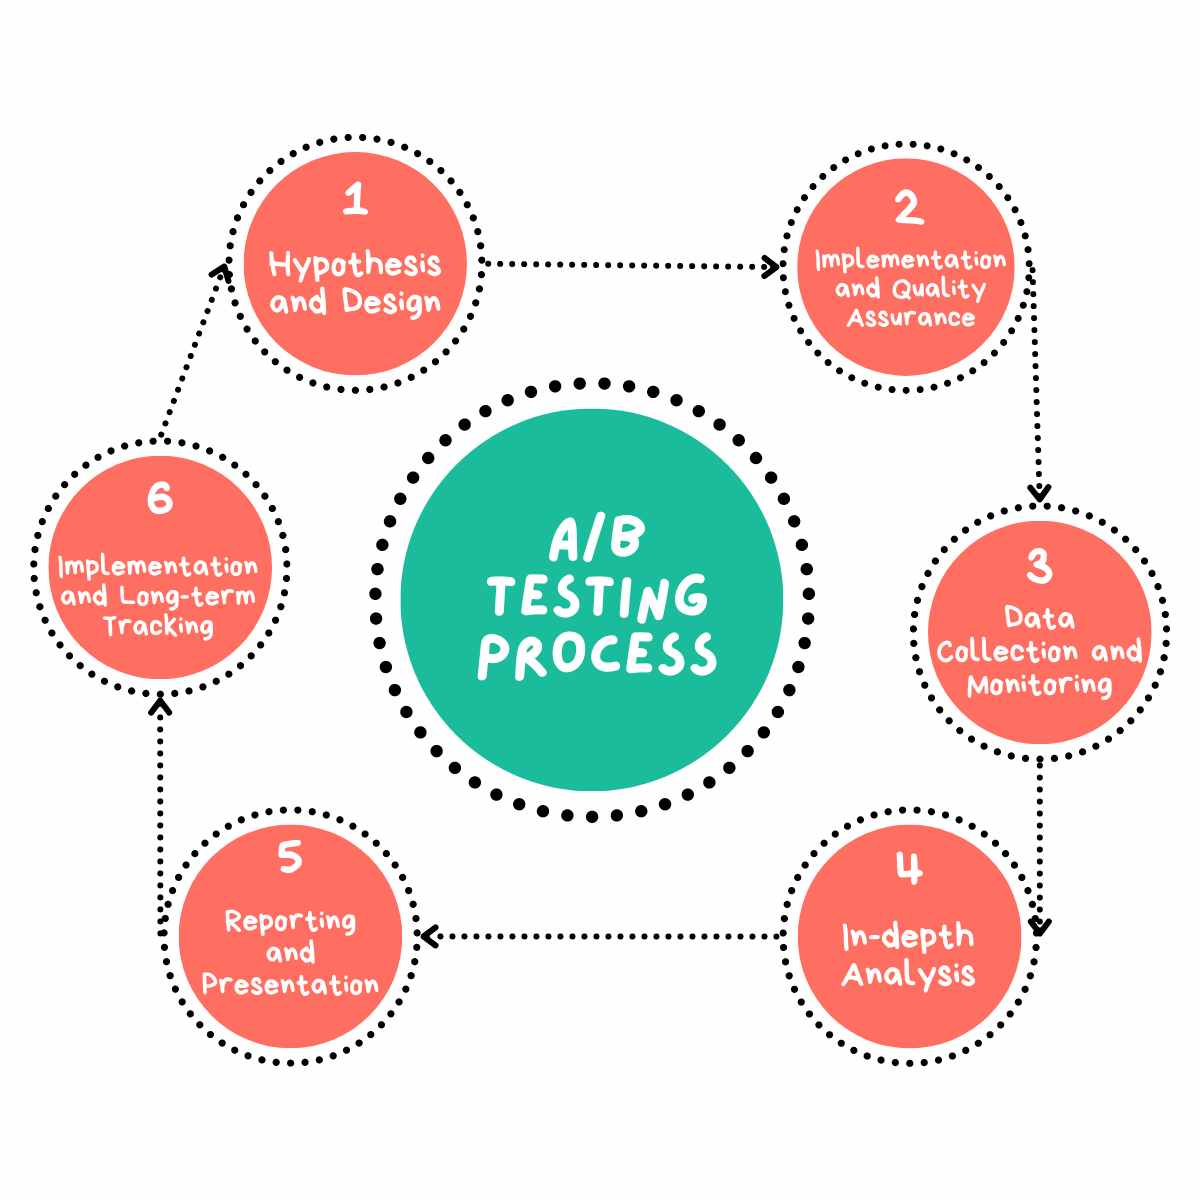
Hypothesis and Design: I develop clear, testable hypotheses based on user research, analytics data, and heuristic evaluations.
Implementation and Quality Assurance: I collaborate with development teams to implement test variants and tracking code.
Data Collection and Monitoring: I oversee the test, ensuring statistical significance is reached before concluding.
In-depth Analysis: I perform comprehensive analysis of the results, considering both primary and secondary metrics.
Reporting and Presentation: I synthesise findings into a comprehensive, actionable report tailored for different stakeholders.
Implementation and Long-term Tracking: I oversee the implementation of successful variants and monitor their long-term impact.
Why Choose UserFirst UX for Your A/B Testing Needs?
Expert Analysis
Rely on my in-depth knowledge of competitor analysis to sharpen your product’s market position.
Actionable Insights
Competitor analysis is tailored to focus on your product’s specific market and competitive landscape.
Tailored Approach
Receive clear insights on your competitors’ strengths and weaknesses, along with strategic recommendations.
Comprehensive Reports
Obtain detailed, well-structured reports that break down competitor analysis results into actionable strategies.
Ready to Optimise Your Digital Product with A/B Testing?
Whether you’re looking to improve conversion rates, enhance user experience, or validate design decisions, A/B testing provides the data you need for informed decision-making. Contact me today to discuss how my A/B testing reports can help optimise your digital product’s performance and drive business growth.