Heatmap and click tracking reports offer visual and data-driven insights into how users interact with your digital products, helping to identify areas for improvement and optimisation.
Who needs Heatmap and Click Tracking Reports?
- UX designers optimising page layouts and CTAs
- Digital marketers maximising conversion elements
- Product owners validating feature placement
- Web developers improving interactive elements
- Content strategists enhancing engagement zones
Heatmap and click tracking reports are detailed analyses that visualise user interactions on websites or applications. They use colour-coded representations to show where users focus their attention, click, and how far they scroll.
Interaction Maps
Click patterns and scroll depth visualizations.
User Tracking
Cursor behavior and element engagement data.
User Comparison
Behavior patterns across segments and devices.
Conversion Path
Journey analysis and success metrics.

Why Heatmap and Click Tracking Reporting Matters
✓ Evidence-Based Design: Heatmaps and click-tracking tools help teams understand user behaviour and make data-driven interface decisions (Nielsen Norman Group, 2023)
✓ Conversion Optimisation: Analysing user interaction patterns via heatmaps allows teams to optimise layouts and CTAs, improving conversion rates (ContentSquare, 2023)
✓ Resource Efficiency: Heatmaps highlight high-impact areas of user interaction, helping teams prioritise fixes and improvements efficiently (Smart Insights, 2023)
Users pay significantly more attention to content placed near the top of a page. Research by Nielsen Norman Group shows that users’ visual attention decreases as they scroll, highlighting the importance of placing key information prominently (Nielsen Norman Group, 2018)
Benefits of Heatmap and Click Tracking Reporting
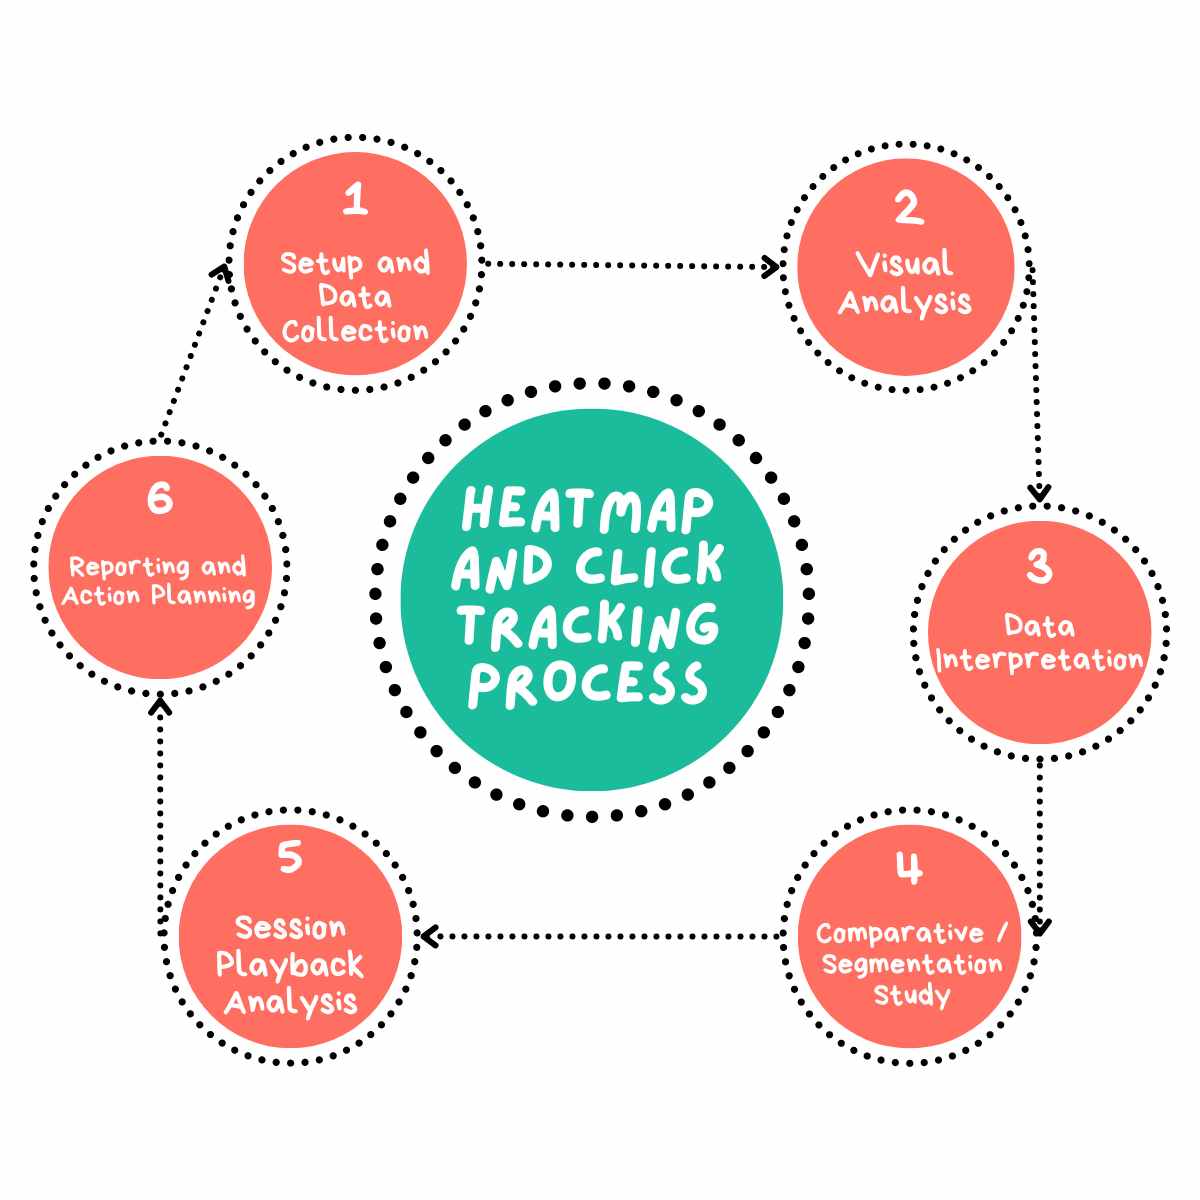
My Heatmap and Click Tracking Process

Setup and Data Collection: I implement appropriate tracking tools on the digital platform.
Visual Analysis: I examine heatmaps and click patterns to identify trends and anomalies, looking for both expected and unexpected user behaviours across the digital platform.
Data Interpretation: I analyse the collected data to extract meaningful insights about user behaviour.
Comparative and Segmentation Study: I compare behaviour across different user segments, devices, and page variations to identify specific needs or issues for distinct user groups.
Session Playback Analysis: I review individual user session recordings to provide context to the aggregated data and identify specific user journeys.
Reporting and Action Planning: I compile a comprehensive report and present these findings to stakeholders.
Why Choose UserFirst UX for Your Heatmap and Click Tracing?
Expert Analysis
Benefit from my years of experience in UX research and user behaviour analysis
Actionable Insights
Receive clear, implementable recommendations to improve your product’s user experience
Tailored Approach
Each user persona is customised to your specific product and industry
Comprehensive Reports
Get detailed, easy-to-understand reports that bring your target users to life
Ready to Visualise Your Users’ Behaviour?
Whether you’re looking to improve conversion rates, enhance user experience, or validate design decisions, heatmap and click tracking reports provide valuable, visual insights into user behaviour. Contact me today to discuss how these reports can help optimise your digital product’s performance and drive user-centric improvements.
