
Metrics Analysis Reports transform quantitative data from user interactions into actionable insights that drive informed design decisions and optimise user experience.
Who needs Metrics Analysis Reports?
- Analytics specialists bridging data and design
- UX leaders proving ROI of design changes
- Product managers tracking feature performance
- Digital teams measuring user engagement
- Stakeholders requiring data-driven decisions
A Metrics Analysis Report examines the quantitative data collected from user interactions with your product or service. By analysing this data, this report uncovers key performance indicators (KPIs) and trends that inform design decisions and help track performance over time, ultimately enhancing your product’s user experience.
Key Components of Metrics Analysis Reports

Why Metrics Analysis Reporting Matters
✓ User Behaviour: Observing actual user behaviour through analytics and A/B testing reveals what users truly do, rather than relying solely on self-reported opinions (Nielsen Norman Group, 2023)
✓ Revenue Impact: Good UX positively impacts conversion rates and profitability, while poor UX can reduce revenue and customer retention (Forrester, 2021)
✓ Competitive Edge: Market-leading companies run significantly more A/B tests than industry followers, allowing them to optimise user experiences faster and maintain a competitive advantage (CXL Institute, 2022)
Companies that invest in measuring and improving UX see up to a 9,900% return on investment, with every dollar spent on UX bringing returns of up to $100 (Forrester, 2022)
Benefits of Metrics Analysis Reporting
My Metrics Analysis Reports Process
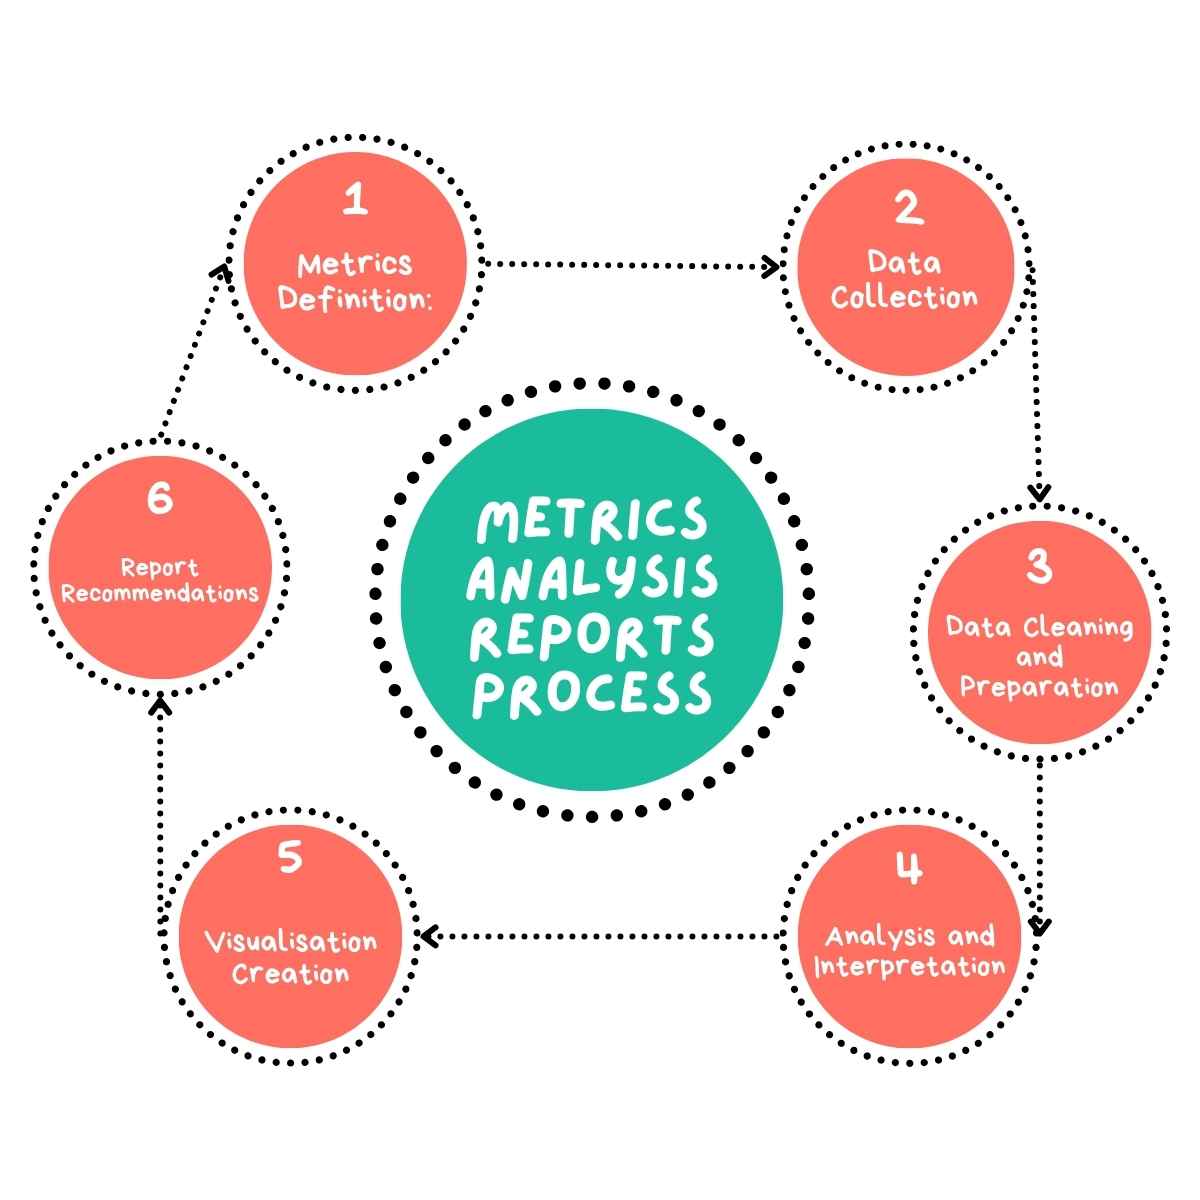
Metrics Definition: I work with stakeholders to define key performance indicators (KPIs) and relevant metrics that align with business goals and user experience objectives.
Data Collection: I gather data from various sources, including web analytics tools, user feedback systems, A/B testing platforms, and customer relationship management systems.
Data Cleaning and Preparation: I clean and prepare the collected data, addressing any inconsistencies, outliers, or missing values.
Analysis and Interpretation: I conduct in-depth analysis of the prepared data, using statistical methods where appropriate.
Visualisation Creation: I develop clear, informative visualisations that effectively communicate the key findings.
Report Compilation and Recommendations: I compile a comprehensive report that provides actionable recommendations for improving user experience.
Why Choose UserFirst UX for Your Metrics Analysis?
My approach to Metrics Analysis Reports combines thorough data collection with in-depth analysis to provide clear, actionable UX insights.
Expert Analysis
Extensive expertise in metrics analysis to gain a deeper understanding of product performance.
Actionable Insights
Receive data-driven recommendations to improve user engagement.
Tailored Approach
Every metrics analysis is customised to focus KPIs that matter most.
Comprehensive Reports
Get detailed, easy-to-understand reports that bring your target users to life
Ready to Turn Your User Interaction Data into Actionable UX Insights?
Contact me today to schedule your Metrics Analysis Report and start making data-driven decisions to enhance your product’s user experience.