
Survey and Questionnaire Reports offer valuable insights into user preferences, satisfaction, and trends. These reports are designed to help you make data-driven decisions that enhance your product and user experience.
Who needs Survey and Questionnaire Reports?
- UX researchers gathering scalable feedback
- Product managers measuring satisfaction
- Marketing teams understanding user preferences
- Stakeholders tracking experience metrics
- Design teams validating decisions
What is a Survey and Questionnaire Report?
A Survey and Questionnaire Report presents a detailed summary of the results obtained from user surveys and questionnaires. It captures the objectives of the survey, demographics of respondents, key findings, statistical analysis, and actionable insights. This report helps you understand your users better by analysing quantitative data. Research shows that well-structured surveys and user feedback instruments help teams collect more reliable and actionable insights, improving design decisions and user satisfaction (Nielsen Norman Group, 2020).
Key Components of Survey and Questionnaire Reports

Why Survey and Questionnaire Analysis Matters
✓ Scale Impact: Surveys and questionnaires allow organisations to collect quantitative insights from large user groups, enabling faster and broader understanding than relying solely on interviews (Nielsen Norman Group, 2023)
✓ Decision Confidence: Data-backed survey results provide evidence for design and business decisions, increasing stakeholder confidence in product direction (Interaction Design Foundation, 2023)
✓ Cost Efficiency: Well-structured surveys are a cost-effective method for gathering user feedback compared to more resource-intensive usability tests (UX Collective, 2021)
Using validated survey methods improves the reliability and usefulness of user feedback, while poorly designed surveys can lead to biased or misleading results (Nielsen Norman Group, 2020).
Benefits of Survey and Questionnaire Reporting- to be completed
My Survey and Questionnaire Reports Process
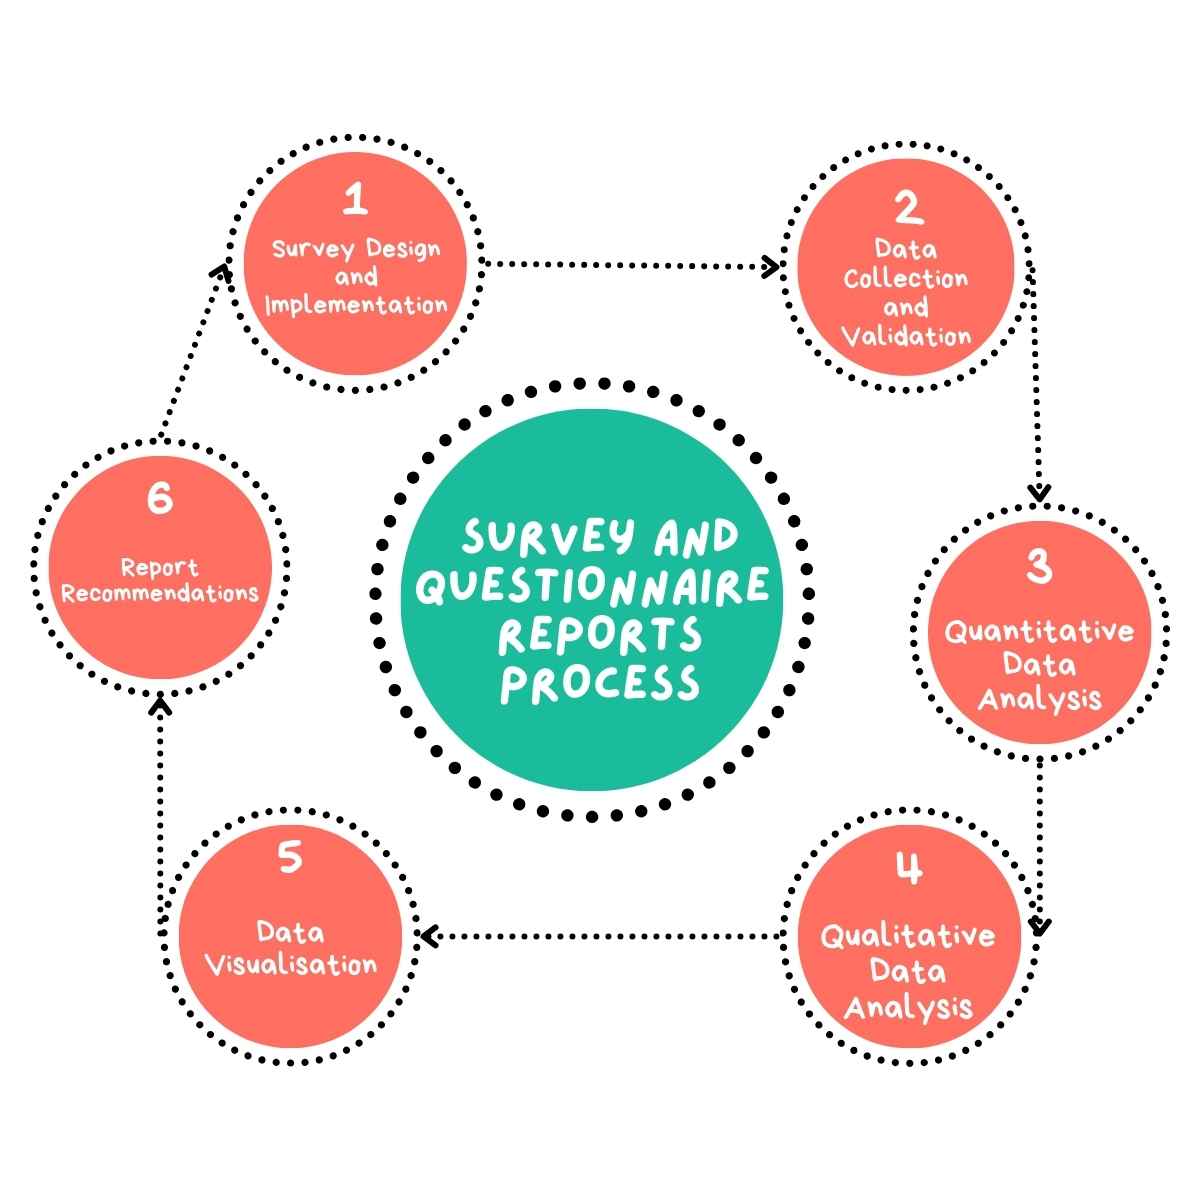
Survey Design and Implementation: I design the survey or questionnaire, carefully crafting questions to address specific research objectives.
Data Collection and Validation: I ensure a sufficient sample size is reached and validate the data, checking for any inconsistencies or incomplete responses that might affect the analysis.
Quantitative Data Analysis: I analyse the numerical data using statistical methods appropriate to the data type and research questions.
Qualitative Data Analysis: For open-ended responses, I conduct thematic analysis to identify recurring themes and insights.
Data Visualisation: I create clear, informative visualisations to represent the key findings.
Report Compilation and Recommendations: I compile all analyses into a comprehensive report with actionable recommendations.
Why Choose UserFirst UX for Your Survey and Questionnaire Analysis?
With extensive experience in survey and questionnaire analysis and a deep understanding of user behaviour, I deliver reports that are detailed, actionable, and tailored to your specific needs. My approach ensures you receive meaningful insights that drive improvements and strategic decisions.
Expert Analysis
Benefit from my years of experience in UX research and data analysis
Actionable Insights
Receive clear, implementable recommendations to improve your product’s user experience
Tailored Approach
Each survey analysis is customised to your specific product and industry
Comprehensive Reports
Get detailed, easy-to-understand reports that cover all aspects of survey analysis
Ready to Unlock Valuable Insights from Your User Surveys?
Contact me today to schedule your survey and questionnaire analysis and receive a comprehensive report that helps you understand user preferences and trends.